
| Hybrid RANS/LES methodology | |
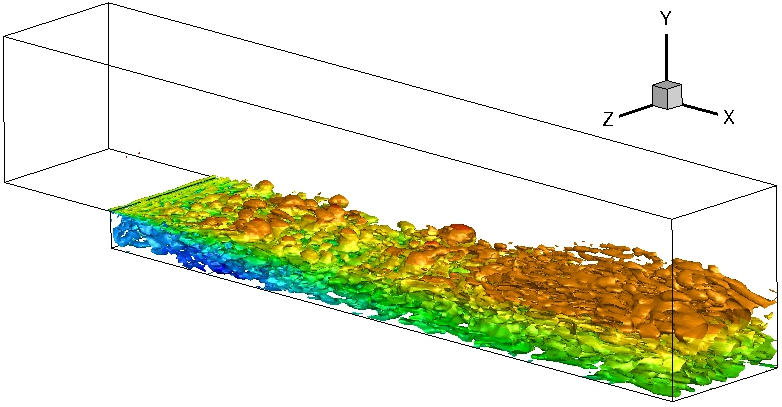 Flow over a backward-facing step: Q iso-surface coloured by mean velocity values depict the unsteady turbulent content generated by our DES model when it switches to eddy simulation mode past the step. |
|
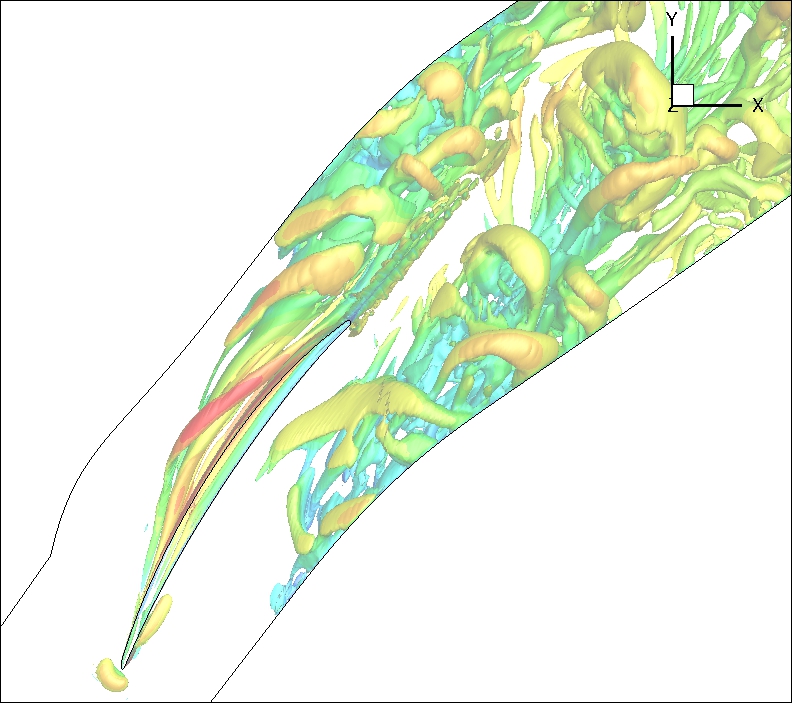 Tip leakage flow in a compressor cascade: The tip gap between the compressor blade and the endwall leads to the generation of a tip leakage vortex, which can be observed from the vorticity iso-surface coloured by mean velocity values. |
|
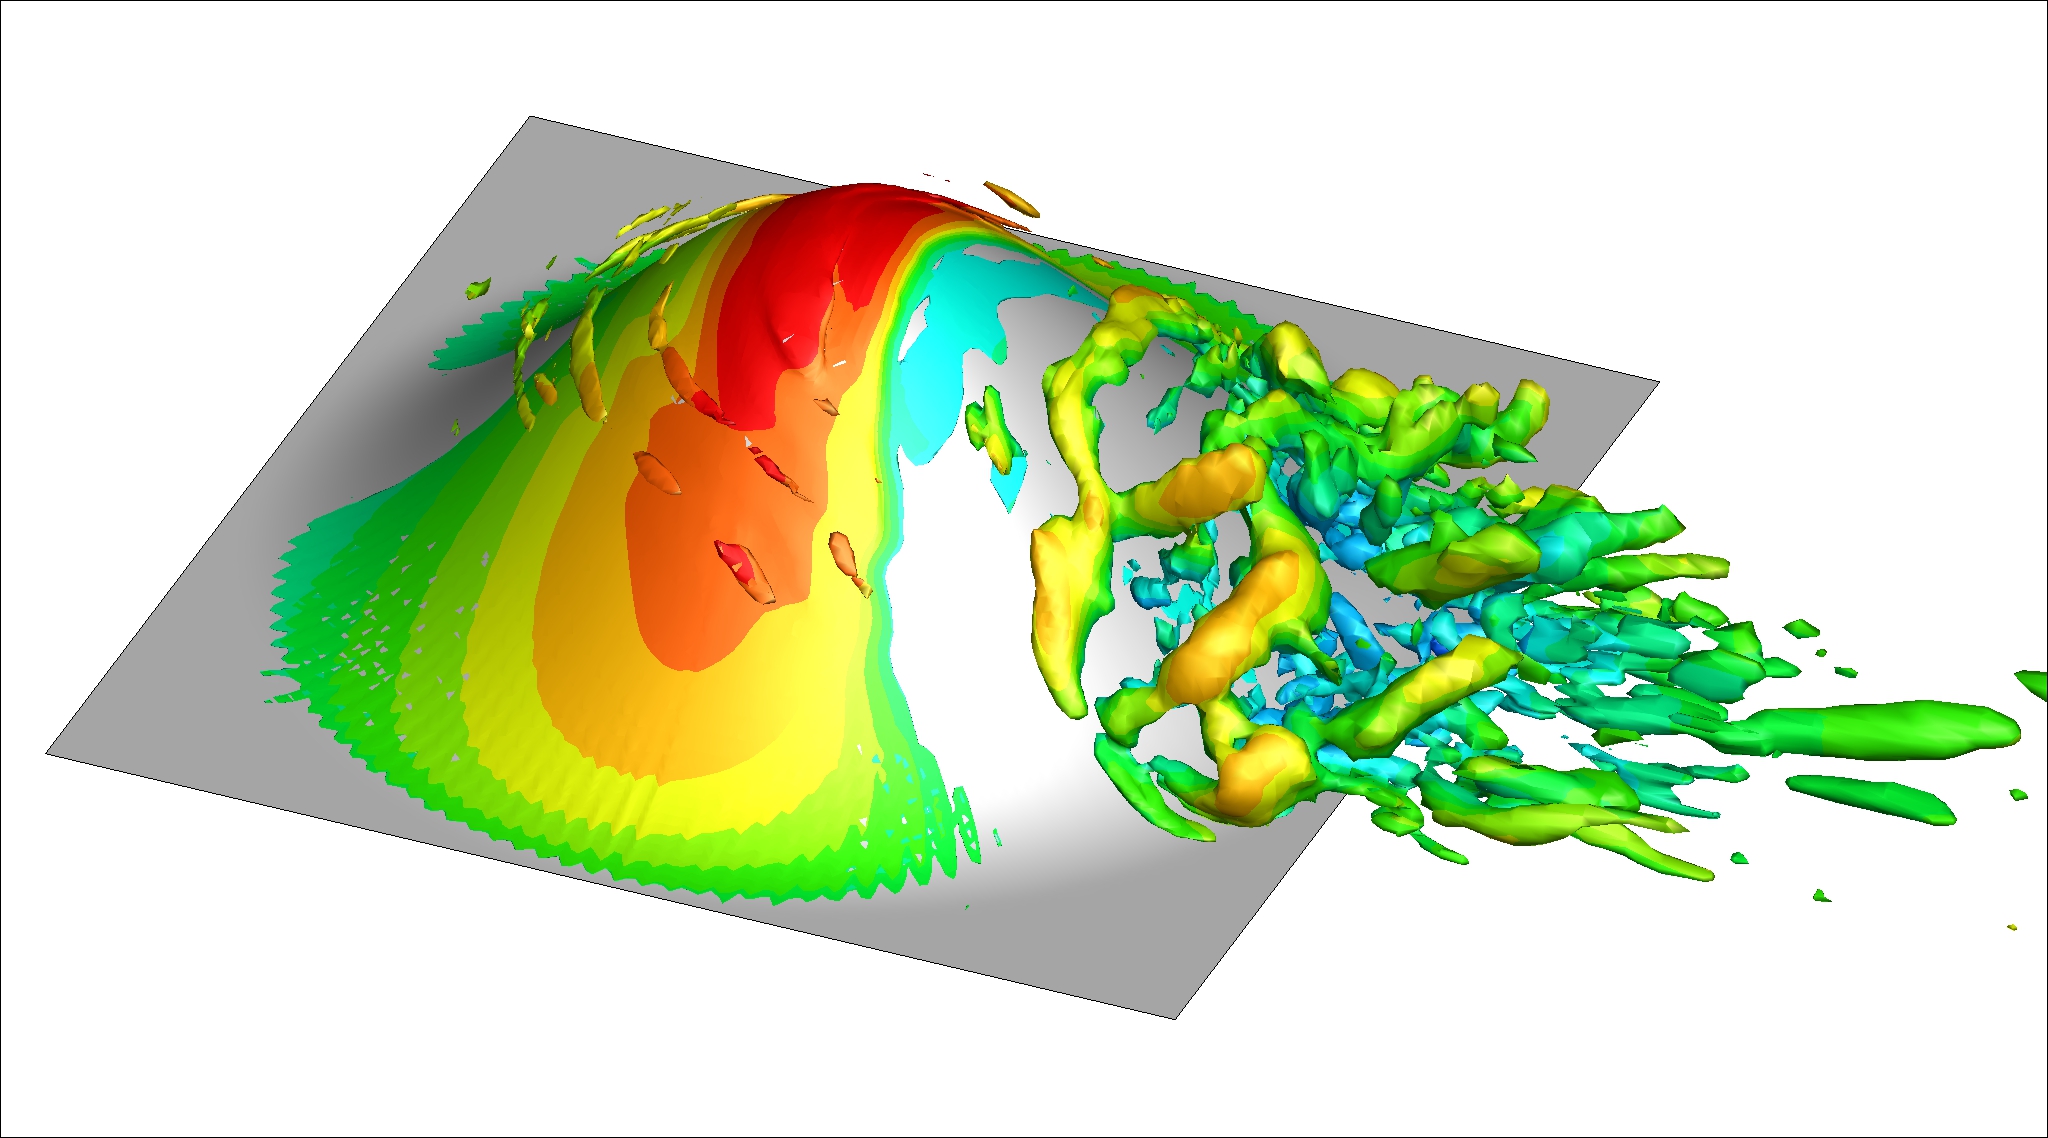 Q iso-surface coloured by contours of instantaneous streamwise velocity in the FAITH hill simulation |
|
 Q iso-surface coloured by contours of instantaneous streamwise velocity in the NASA wall mounted hump simulation. |
|
| Bypass transition model based on the intermittency function | |
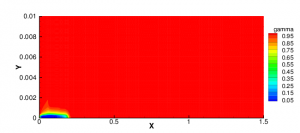
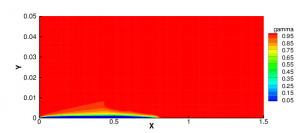 Contours of intermittency function – T3A with modest freestream turbulence intensity |
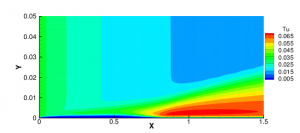 Contours of turbulence intensity – T3A with modest freestream turbulence intensity |
 Contours of intermittency function – T3B with high freestream turbulence intensity |
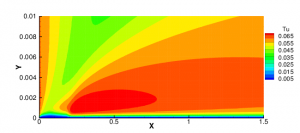 Contours of turbulence intensity – T3B with high freestream turbulence intensity |
| Near wall contours of flat plate cases with zero pressure gradient. | |
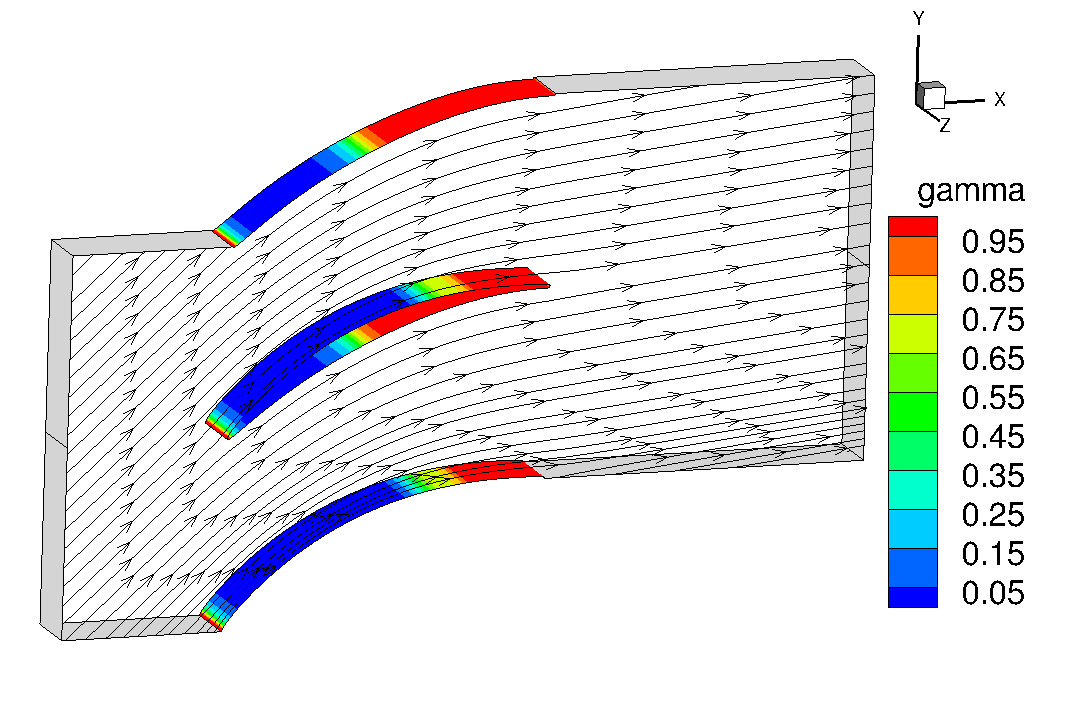 Contours of the intermittency function γ on the surfaces of the V103 low-pressure compressor cascade blades |
|
 Bypass transition induced by periodic wakes impinging on a flat plate depicting by contours of stream-wise velocity. |
|
| Direct numerical simulation of mixed mode transition | |
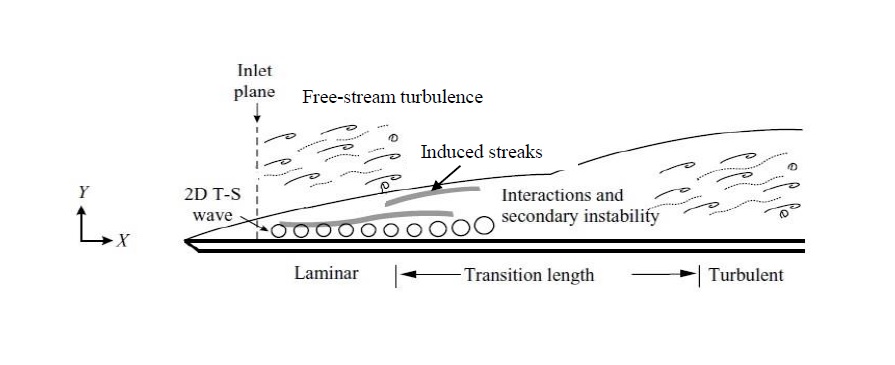 Schematic of the physical experiment corresponding to our numerical experiment |
|
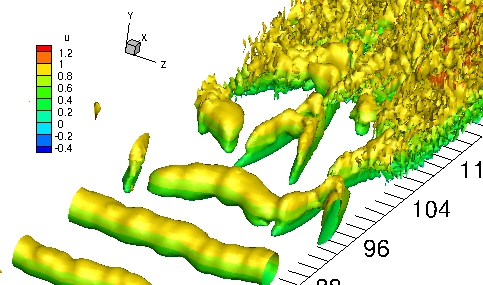 Λ vortices depicted by the Q iso-surfaces |
|
 Animation of in-plane stream-wise fluctuation velocity contours at a fixed height above the wall depicting the arbitrary pattern of Λ vortices. |
|
| Computational predictions of the flowfield that is set up by the fuel injectors in gas turbine engines | |
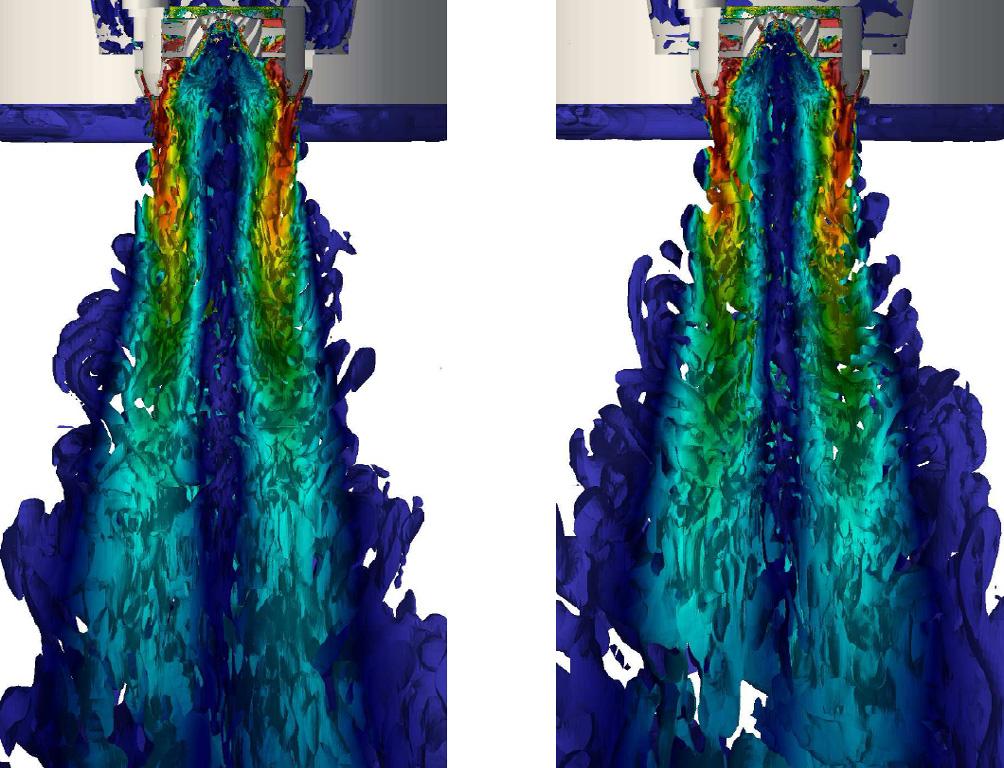 This figure depicts the iso-surface of Q-contours colored by velocity magnitude. The left is the dynamic Smagorinsky LES and the right is the k-omega DDES simulation. |
|
Flow over a backward-facing step: Q iso-surface coloured by mean velocity values depict the unsteady turbulent content generated by our DES model when it switches to eddy simulation mode past the step.
Tip leakage flow in a compressor cascade: The tip gap between the compressor blade and the endwall leads to the generation of a tip leakage vortex, which can be observed from the vorticity iso-surface coloured by mean velocity values.
Q iso-surface coloured by contours of instantaneous streamwise velocity in the FAITH hill simulation
Q iso-surface coloured by contours of instantaneous streamwise velocity in the NASA wall mounted hump simulation.
Bypass transition model based on the intermittency function
Contours of intermittency function – T3A with modest freestream turbulence intensity
Contours of turbulence intensity – T3A with modest freestream turbulence intensity
Contours of intermittency function – T3B with high freestream turbulence intensity
Contours of turbulence intensity – T3B with high freestream turbulence intensity
Near wall contours of flat plate cases with zero pressure gradient.
Contours of the intermittency function γ on the surfaces of the V103 low-pressure compressor cascade blades
Bypass transition induced by periodic wakes impinging on a flat plate depicting by contours of stream-wise velocity.
Direct numerical simulation of mixed mode transition
Schematic of the physical experiment corresponding to our numerical experiment
Λ vortices depicted by the Q iso-surfaces
Computational predictions of the flowfield that is set up by the fuel injectors in gas turbine engines
This figure depicts the iso-surface of Q-contours colored by velocity magnitude. The left is the dynamic Smagorinsky LES and the right is the k-omega DDES simulation.
DNS of turbulent flow
Animation of turbulent flow over cubes on the floor of a channel, developing downstream over a smooth section.