Research in space domain awareness is crucial for monitoring and understanding the activities and objects in Earth’s orbit. It enhances the ability to track satellites, detect potential collisions, and identify space debris. This knowledge is vital for ensuring the safety of space missions, protecting assets, and maintaining the long-term sustainability of space operations.
Space Domain Awareness
Space Environment Modeling
The SPACE Lab works alongside its MIT partners to help develop the MIT Orbit Capacity Assessment Tool (MOCAT), a model for the forecasting of the LEO space population orbiting in LEO. The SPACE lab supports MIT’s development of MOCAT-SSEM, the Source-Sink Evolutionary Model of the tool.
MOCAT-SSEM investigates the evolution of the space objects population in LEO by exploiting a new probabilistic source-sink model, with the objective of estimating the LEO orbital capacity. This is carried out through the long-term propagation of the proposed source-sink model, which globally takes into account different object species, such as active satellites, derelict satellites, debris, and additional subgroups. Since the SOs are propagated as species, the information about single objects is missing, but it allows to be computationally fast and provide essential information about projected future distribution of SOs in the space environment for long prediction horizon. MOCAT-SSEM is developed in MATLAB and is available for download here.
During his time at MIT, Dr. Servadio helped develop the MOCAT-4N version, which globally considers different object species, such as active satellites (S), derelict satellites (D), and debris. In this model, the debris species are divided into the following two subgroups: trackable (N) and nontrackable debris (also referred to as untracked debris (U)), the last ones representing a significant threat to active satellites. Indeed, the inability to track some debris leads to more
unexpected catastrophic events (i.e., collisions) because active satellites cannot perform collision avoidance maneuvers in time. The following video shows a 200 years simulation of the LEO space environment following the MOCAT-4N model.

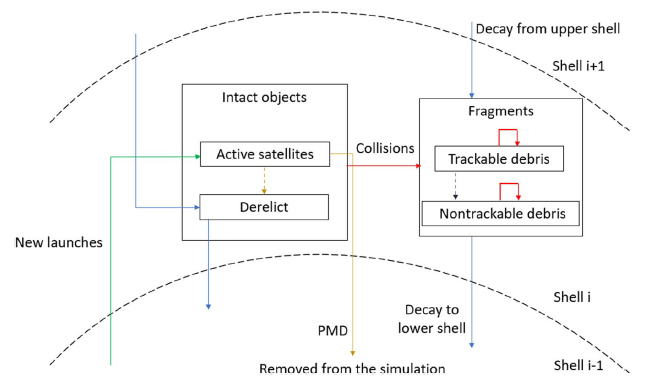
A schematic representing the qualitative interactions among the species is illustrated in the figure. As can be seen, the only source of the active satellite population is represented by the new launches. Therefore, the term that regulates the new launches is the annual launch rate. At the same time, following the PMD guidelines, active satellites are removed from the simulation after Δt years of operational life. However, it is also likely that not all the active satellites succeed in performing PMD, thus becoming derelicts. This transition is considered by modeling the probability of success PM of PMD. The other modeled phenomena are the collisions, the natural orbital decay caused by the atmospheric drag, and the interaction between tracked and untracked debris, which depend on the sensing capabilities.

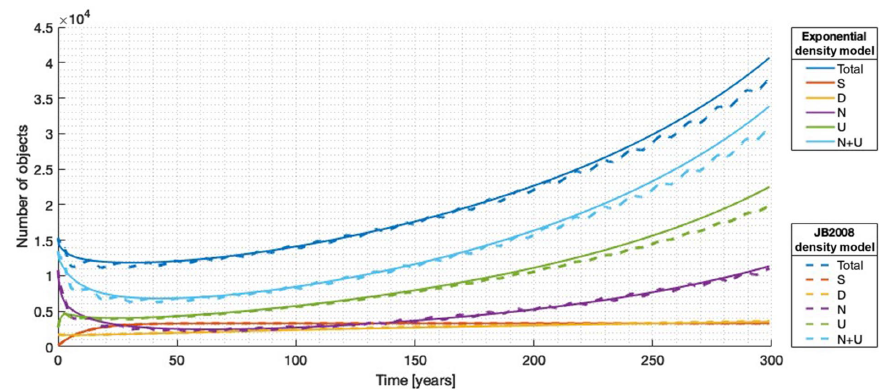
This figure shows the evolution of the different ASO populations under the static exponential density model and the JB2008 density model. The evolution of the ASO populations follows a similar trend for both scenarios. However, the ASO populations under the JB2008 density model show an oscillatory behavior. In addition, it can be observed that the difference between the two models increases with propagation time.
In the following work, a new model, MOCAT-6RD, introduces the effects of orbit raising and decay from active satellites.

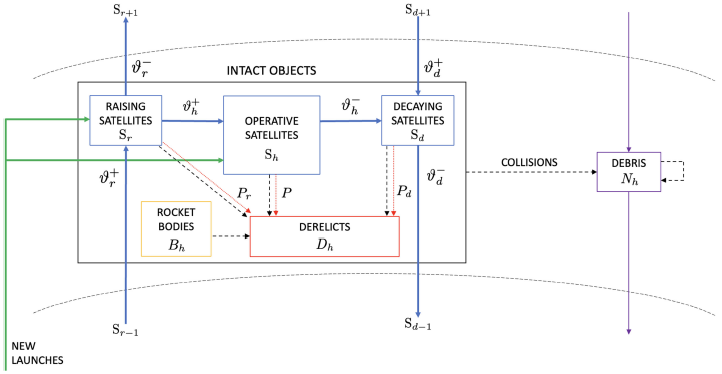
Active satellites, rocket bodies, and derelicts constitute intact objects. Collisions, represented by dashed black arrows, could involve objects from
the same or different species, giving rise to derelicts and debris or debris only. Moreover, derelicts might be created from each category
composing active satellites. These transitions are indicated with the dotted red arrows. For what concerns active satellites, both Sr and Sh are launched, represented by green arrows, while the category transitions among the S families and the flow between different shells are indicated with ϑ. Let the model
considering Sh, Sr, Sd, D, N, B be referred to as the MOCAT-6RD, where “6” represents the number of species involved, and “RD” indicates that orbit raising and deorbiting maneuvers are included. The model without decaying satellites Sd is named MOCAT-5R, with “5” as the species involved and “R” signifying that orbit raising is modeled (the “D” is omitted as deorbiting is not included). Lastly, the simplified model lacking orbit transfer flux is named MOCAT-4B, with four species included, denoted as S, D, N, and B. Here, “B” represents rocket bodies and serves to distinguish this model from other models that also have four species but exclude rocket bodies.
Debris Ranking
Similarly to MOCAT-SSEM, a Monte Carlo version of the software, MOCAT-MC, has been developed by the MIT team. Dr. Servadio used the model to rank the most dangerous debris orbiting in LEO.

The flowchart schematic for the MOCAT-MC tool is shown in the figure. Consistent with any Monte Carlo tool, a single simulation of the MOCAT-MC tool consists of multiple runs of the model, where each time, a different outcome from the stochastic variables is realized, according to the associated probability density function (PDF). Indeed, a list of various PDFs is developed to model any stochastic element, such as the probability of collision between two close RSOs, or the probability of failure for end-of-life disposal of a satellite and so on, following the reference models.
The figure underlines the sources of RSO with +, where new payloads are added to the population according to the launches or debris generated due to collisions and explosions. At the same time, the space population gets reduced,⊖ a sign of the sink, by natural deorbit of debris thanks to atmospheric drag and by reentry of those payloads that succeed their PDM at their end of life.

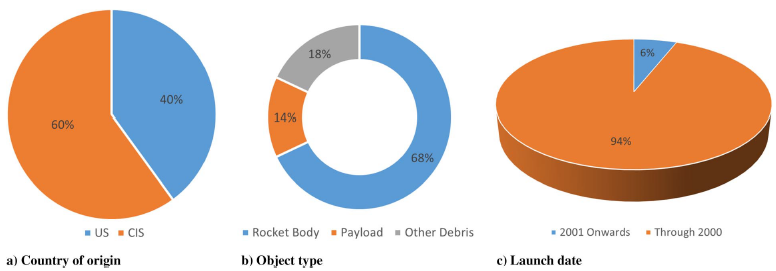
Dr. Servadio developed the MITRI risk index to rank the most dangerous debris orbiting in LEO following the results and simulations from MOCAT-MC. Whenever analyzing the nature of these highly ranked RSOs, the below figure shows that they are human-made debris, with origin either Russian or
American (a). As expected, most of them are massive rocket bodies, while the remainder are derelict satellites that never had or failed their PDM (b). Indeed, these debris date back before to the year 2001, when mitigation guidelines were not yet mandatory, or they got abandoned before mitigation guidelines were established (c).
Threat Level Estimation
Convex Hull of Debris for two Resident Space Objects Colliding.
Use ov NASA Standard Break Up Model EVOLVE 4 model to Create Convex Hull of Debris.
The NASA SBM creates the set of possible velocities that debris might have after a breakup event in space. Due to the stochastic nature of the event, each time a collision is simulated, a different set of velocities is created, meaning that, in order to have a comprehensive representation of the debris, the simulation must be repeated multiple times, following a Monte Carlo approach. This procedure results in a list of orbits represented according to their velocity vectors since they share the same position, which is the collision or explosion location. However, regardless of how many simulations are performed, the point-wise representation of the set of debris velocities is incomplete and faulty since any velocity between two outcomes could have been a valid solution. The SBM provides a discrete representation of velocities over the desired continuous function. Therefore, it is needed to implement techniques that encapsulate the region of space in the velocity domain that encloses all of the possible velocities that debris could have after the breakup event.
One side of every possible orbit connecting from a collision point to the asset orbit (10 deg separation)
Evaluation of the Transfer Cones From Collision Location to Asset’s Orbit
The figure shows the family of transfer orbits connected to Side A, where the debris reaches the asset from above. Indeed, Side A orbits are those that intersect the asset orbit coming from above. The figure shows a few orbits from each velocity hyperbola, with a different DASTPM evaluated every 10 degrees in true anomaly of the asset orbit, reported in yellow. Side B of the solution is not reported in the figure, but it would cover the second cone, the one related to velocity hyperbolas connected to transfer orbits that cross the asset’s orbit with the debris reaching from below. The figure shows the different approach used to solve the same problem. Working with deviation from previously derived solutions, it is easier to compute all the velocity hyperbolas on one side of the asset orbit since the curves are close to each other in the velocity domain.
Threat evaluation. Transfer orbit surfaces and debris hulls.
Threat Evaluation is Assessed by Checking Overlapping.
The figure reports the two cones of possible velocities that intersect the break-up point with the asset orbit. Each cone is one single color, one for Side A and another for Side B, as the map solves the velocity hyperbola following a different approach, where there is no need to know if the orbit is prograde or retrograde. The hulls intersect the cone, meaning that the Iridium-Kosmos collision is a threat to the asset satellite.
Other
NCUR video award, SPACE lab members Jonak Bhagawati and Sushant Chiramana and coauthor of “Development of a Temporal Space Debris Population Calculator” awarded best research video in 2024 National Conference on Undergraduate Research, April 8-10, Long Beach, CA
